Posts

Trading with H&S Pattern along with Triangle and Divergence

Image
Risk Warning : Trading Forex, Stock, and CFDs may not be suitable for all investors as they carry a high degree of risk to your capital. Please ensure you fully understand the risks involved before trading or investing, and if necessary seek independent advice. Trading with H&S Pattern along with Triangle and Divergence When there will be H&S pattern, then triangle and divergence will appear most of the time. These provide an advantage for trading H&S. It is helpful to get into position early and also exit if necessary.  H&S tops are strong performers in a bull market, showing a small break even failure rate and large average decline if traded perfectly. Pullbacks occur almost two-thirds of the time, so anticipate them happening. Example 1 : Fortune Pattern : Simple H&S and Symmetrical Triangle. Example 2 : Cadila Healthcare LTD Pattern : Complex H&S and Symmetrical Triangle. There was 1 left shoulder, 2 head, and 2 right shoulder. Divergenc

BITCOIN Review | 4M of Trading | Got Return? Become An Investor

Image
DISCLAIMER:  Although I have been correct about these analysis dozens of times, it doesn't mean that I am correct this time. You'll have to connect to the information and then will have to make a decision for yourself. This is purely based on my expert opinion and there are no guarantees. Trading stock, forex etc carries high risk. As you trade with your own risk, be self-dependent and learn properly. BTCUSD Review RSI has moved over 50 and broken out the descending trendline (Pink Color) towards upside. RSI is showing momentum is up. Also we see price can not close bellow the neckline. There a bullish hammer is formed. It's a clear bullish signal. Recently we saw price had fallen down sharply after showing a regular bearish divergence. After that we saw Bullish Momentum on 4hr chart. Price and RSI had broken descending trend-line towards upside and it was the first signal of impending trend reversal. Also there was a bullish Fakey setup. After that price got inc

HEIDELBCEM Review | Dhaka Stock Exchange | 4M of Trading | Got Return? Become An Investor

Image
DISCLAIMER:  Although I have been correct about these analysis dozens of times, it doesn't mean that I am correct this time. You'll have to connect to the information and then will have to make a decision for yourself. This is purely based on my expert opinion and there are no guarantees. Trading stock, forex etc carries high risk. As you trade with your own risk, be self-dependent and learn properly. HEIDELBCEM Review Price has completed a cycle which has taken 9 years to complete. It has taken six & a half years to complete the impulse wave and two & a half years to complete the corrective wave. While price was in the impulse wave, we saw Inverse Head & Shoulder, Rounding Bottom, and Rectangle which had completed the uptrend through impulse wave gradually. After completing impulse wave, we saw Zigzag correction (Leading Diagonal in its wave A) and Head & Shoulder which had completed the corrective wave gradually. *** Key Lesson : Market Is Telli

PTL Review | Share Analysis | Dhaka Stock Exchange | Got Return? Become An Investor

Image
DISCLAIMER:  Although I have been correct about these analysis dozens of times, it doesn't mean that I am correct this time. You'll have to connect to the information and then will have to make a decision for yourself. This is purely based on my expert opinion and there are no guarantees. Trading stock, forex etc carries high risk. As you trade with your own risk, be self-dependent and learn properly. PTL Review It's an interesting fact when it comes to making a decision on buying or selling a share. Because traders then classified themselves into 2 categories. Technicians and Fundamentalists. But in reality, there is lots of overlap. As per Technical Analysis on 11 September 2017 : Two bullish factors are working on the chart now : 1. Flag Pattern : Flags and Pennants are short-term continuation patterns that mark a small consolidation before the previous move resumes. These patterns are usually preceded by a sharp advance or decline with heavy volume

Exhaustion Flag Pattern | Forex & Stock Education | Got Return? Become An Investor

Image
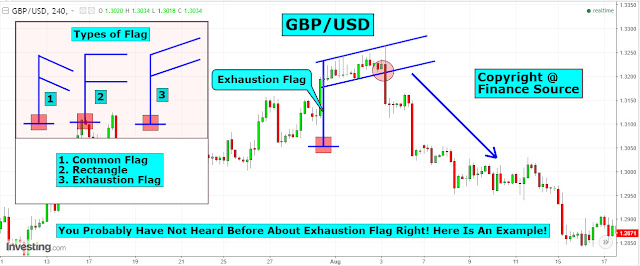
Risk Warning : Trading Forex, Stock, and CFDs may not be suitable for all investors as they carry a high degree of risk to your capital. Please ensure you fully understand the risks involved before trading or investing, and if necessary seek independent advice. Flag Pattern Flags are short-term continuation or reversal patterns that mark a small consolidation before the previous move resumes or ends. These patterns are usually preceded by a sharp advance or decline with heavy volume. Types of Flag Pattern : Based on Flag's direction, there are 3 types of Flag Pattern. 1. Common Flag : Flag Direction - Down. 2. Rectangle : Flag Direction - Horizontally Parallel. 3. Exhaustion Flag : Flag Direction - Up. Exhaustion Flag : Exhaustion flags are those that happen at the end of a good up- or downtrend. They provide the major signal of the end of that move.  Example : An Exhaustion Flag was formed at GBP/USD pair on the 4hr time-frame at the starting of August 2017

GEMINISEA Review | Share Analysis | Dhaka Stock Exchange | Got Return? Become An Investor

Image
DISCLAIMER:  Although I have been correct about these analysis dozens of times, it doesn't mean that I am correct this time. You'll have to connect to the information and then will have to make a decision for yourself. This is purely based on my expert opinion and there are no guarantees. Trading stock, forex etc carries high risk. As you trade with your own risk, be self-dependent and learn properly. GEMINISEA Review It's an interesting fact when it comes to making a decision on buying or selling a share. Because traders then classified themselves into 2 categories. Technicians and Fundamentalists. But in reality, there is lots of overlap. As per Technical Analysis on 17 August 2017 : * Pattern = Bullish Island Reversal Pattern * Bullish Island Reversal Pattern = Bearish Exhaustion Gap + Bullish Breakaway Gap. * The price has broken the long term 'Descending Channel' level towards upside. * According to 'Bullish Island Reversal Pattern

PUBALIBANK Review | Share Analysis | Dhaka Stock Exchange | Got Return? Become An Investor

Image
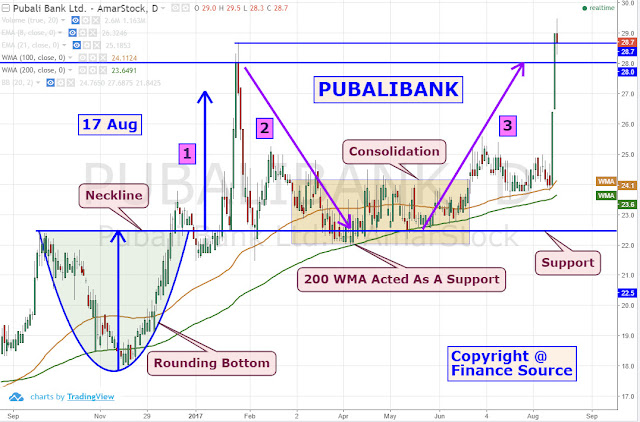
DISCLAIMER:  Although I have been correct about these analysis dozens of times, it doesn't mean that I am correct this time. You'll have to connect to the information and then will have to make a decision for yourself. This is purely based on my expert opinion and there are no guarantees. Trading stock, forex etc carries high risk. As you trade with your own risk, be self-dependent and learn properly. PUBALIBANK Review It's an interesting fact when it comes to making a decision on buying or selling a share. Because traders then classified themselves into 2 categories. Technicians and Fundamentalists. But in reality, there is lots of overlap. As per Technical Analysis on 17 August 2017 : Point-1: 'Rounding Bottom' was formed and the price went up from 17.80 Tk to 28.70 Tk.  Rounding Bottom Neckline was at 22.50 Tk. Point-2: After hitting the price target according to the Rounding Bottom, price faced a key resistance at 28 Tk and then moved do